Price, volume and open interest are the most important metrics to analyze when you’re doing futures trading. Granted, cryptocurrencies have their own merit of analysis, and high volatility so it isn’t exactly the same as a commodities futures market where there is more liquidity.
Futures Crypto Trading
Understanding futures markets metrics, to stay informed. Price, Volume, Open Interest and how they all tie together.
Among these metrics, price is the most important metric, and any changes in volume / open interest with respect to price can decide the trend and strength of the market.
Volume relates to the amount of trading that is occurring, for every seller there is a buyer so its sometimes hard to determine who is a buyer and who is a seller. By analyzing the patterns of price, open interest and volume we can determine the next move of the market.
Volume measures the pressure behind a price trend and typically volume will precede any change in price. Substantial changes in volume could bring in a rise or fall of prices.
Open Interest is the total number of outstanding positions that aren’t delivered by the end of the day, given cryptocurrencies never sleep this metric is constantly changing 24/7. Open Interest measures the the flow of money into crypto futures markets. For each buyer, there is a seller, combining the both gives you the value of Open Interest as a metric.
Increases in OI (Open Interest) indicates new money is coming into the playing field, this could continue the current trend or start a new trend. Vice versa for decreases in OI, would mean that the current trend is coming to an end and traders are liquidating. A flatline of OI can indicate that the end of a bull run is over, if there has been substantial prices increases to the asset over a period of time. Remember though, this is crypto and it’s volatile as hell.
Effect of Price, Volume and Open Interest with the current trend
The standard ideology behind the trend, with price open interest and volume is as such:
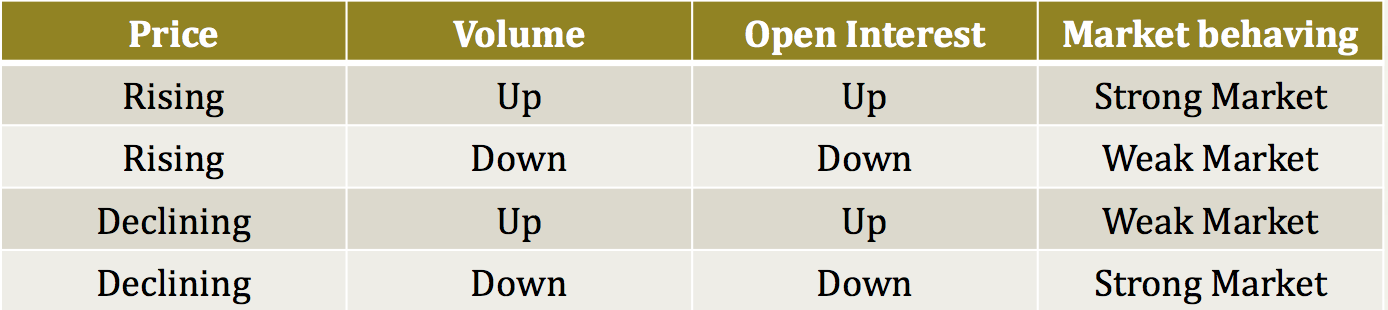
Situation 1 indicates that price, volume and open interest are rising, indicating a good market and that longs are in favour.
Situation 2 suggests short sellers are covering their positions, however the general market trend indicates a weak market as volume and open interest are decreasing.
Situation 3 shows that price is declining, however open interest and volume are on the rise. This indicates that very aggressive short selling is entering the market.
Situation 4 indicates that if price, volume and OI are in a declining mode, signals that long position holders are winding off their short positions and likely be the end of downtrend when all sellers sold their positions. This indicates a strong market. However don’t confuse strong market with a bullish outlook, we’re talking futures here. You can be profiting as a bear or a bull, the bearish/bullish scenario outlooks will be covered below however.
Credit: Geofin.
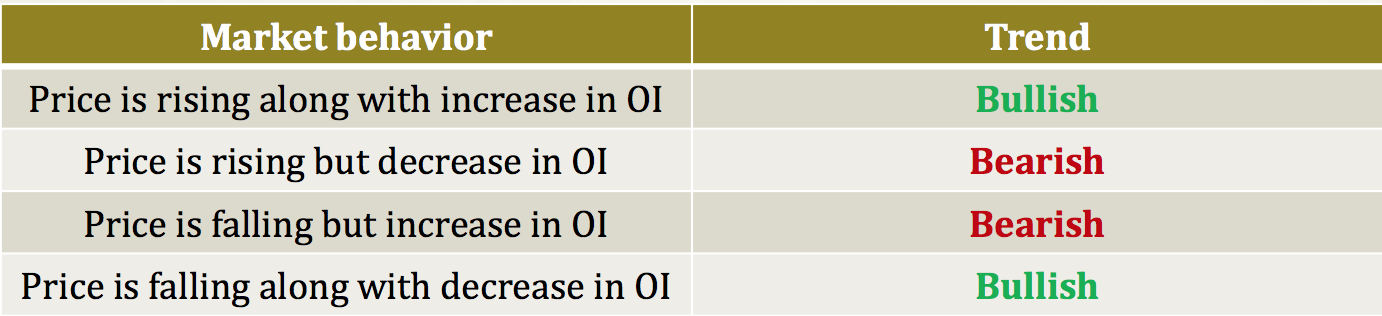
Let’s assume the market is at the top, if Open Interest is high and prices are falling a trend reversal may be coming into play and considered bearish with people starting to panic sell, emotions take over.
Let’s see how this works with crypto?
The below, shows information for the last 6 hours as of Wed Sep 5 01:14:46 BST 2018. This is Open Interest / Volume and Price data for Bitmex.
Yellow is open interest, green is volume and red is price in the below examples.
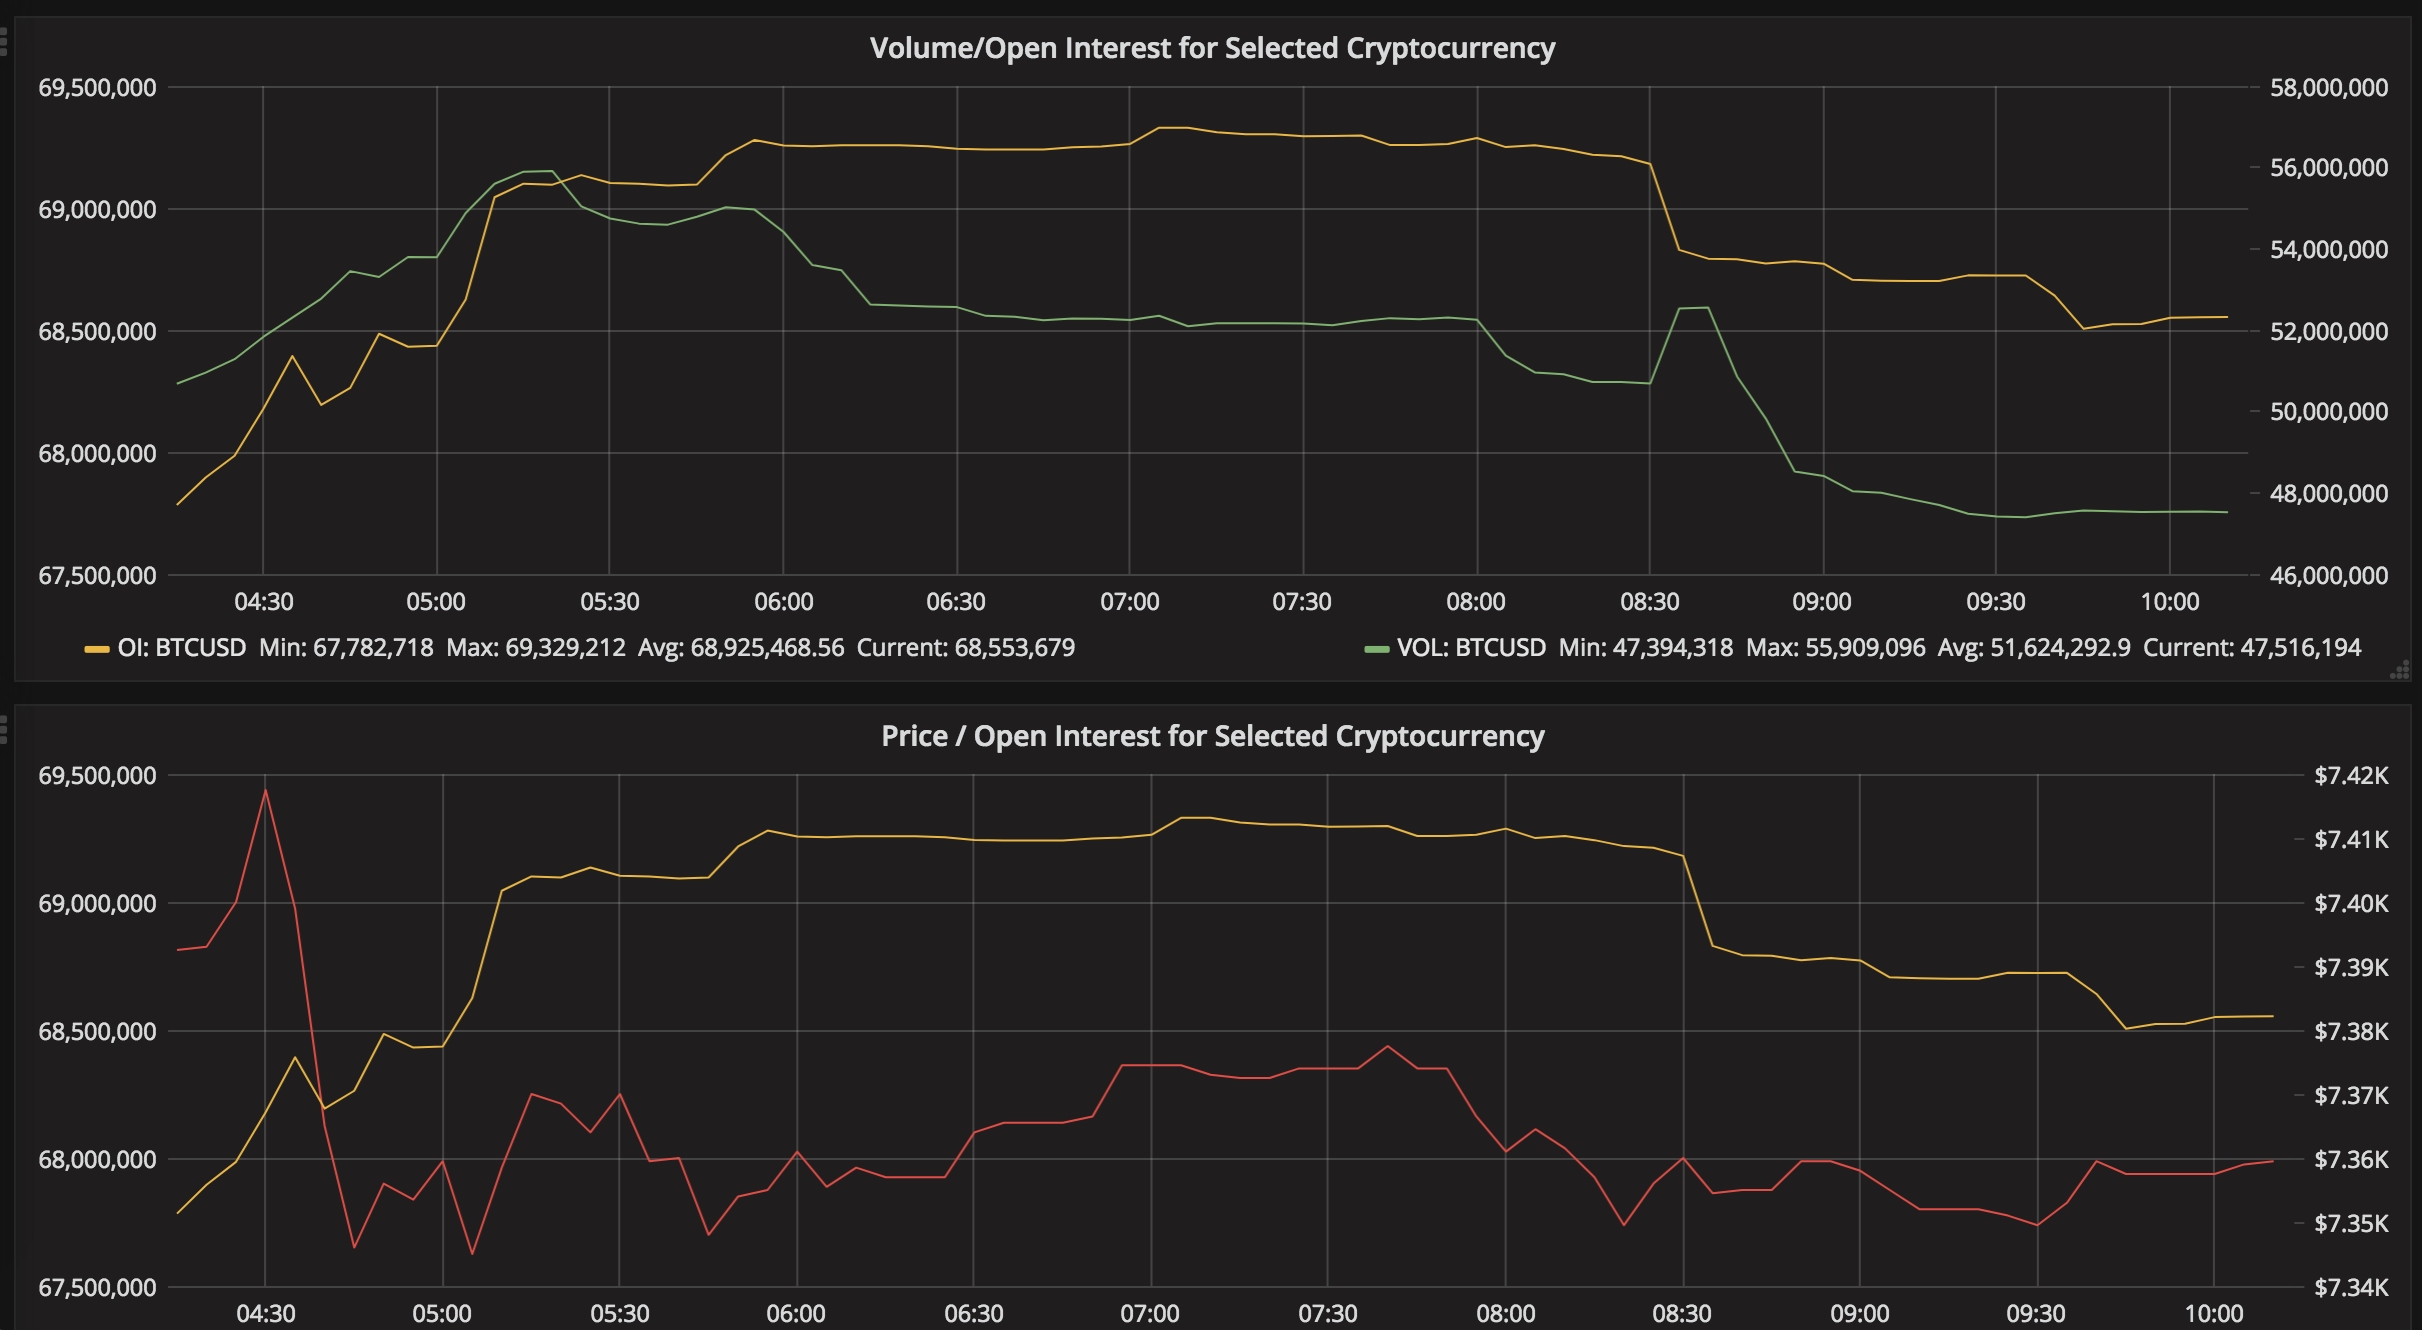
Let’s take a look at what happened right before the 05:00 mark, where Open Interest and Volume increased, but prices dropped.
How could we anticipate something like that happening? The answer is you can’t. You can’t read the mind of the market however if you have already charted Bitcoin for example, and are aware of key support and resistance levels you can use Open Interest, Volume and Price to confirm your position. Let’s take a look at the history of the past 7 days:
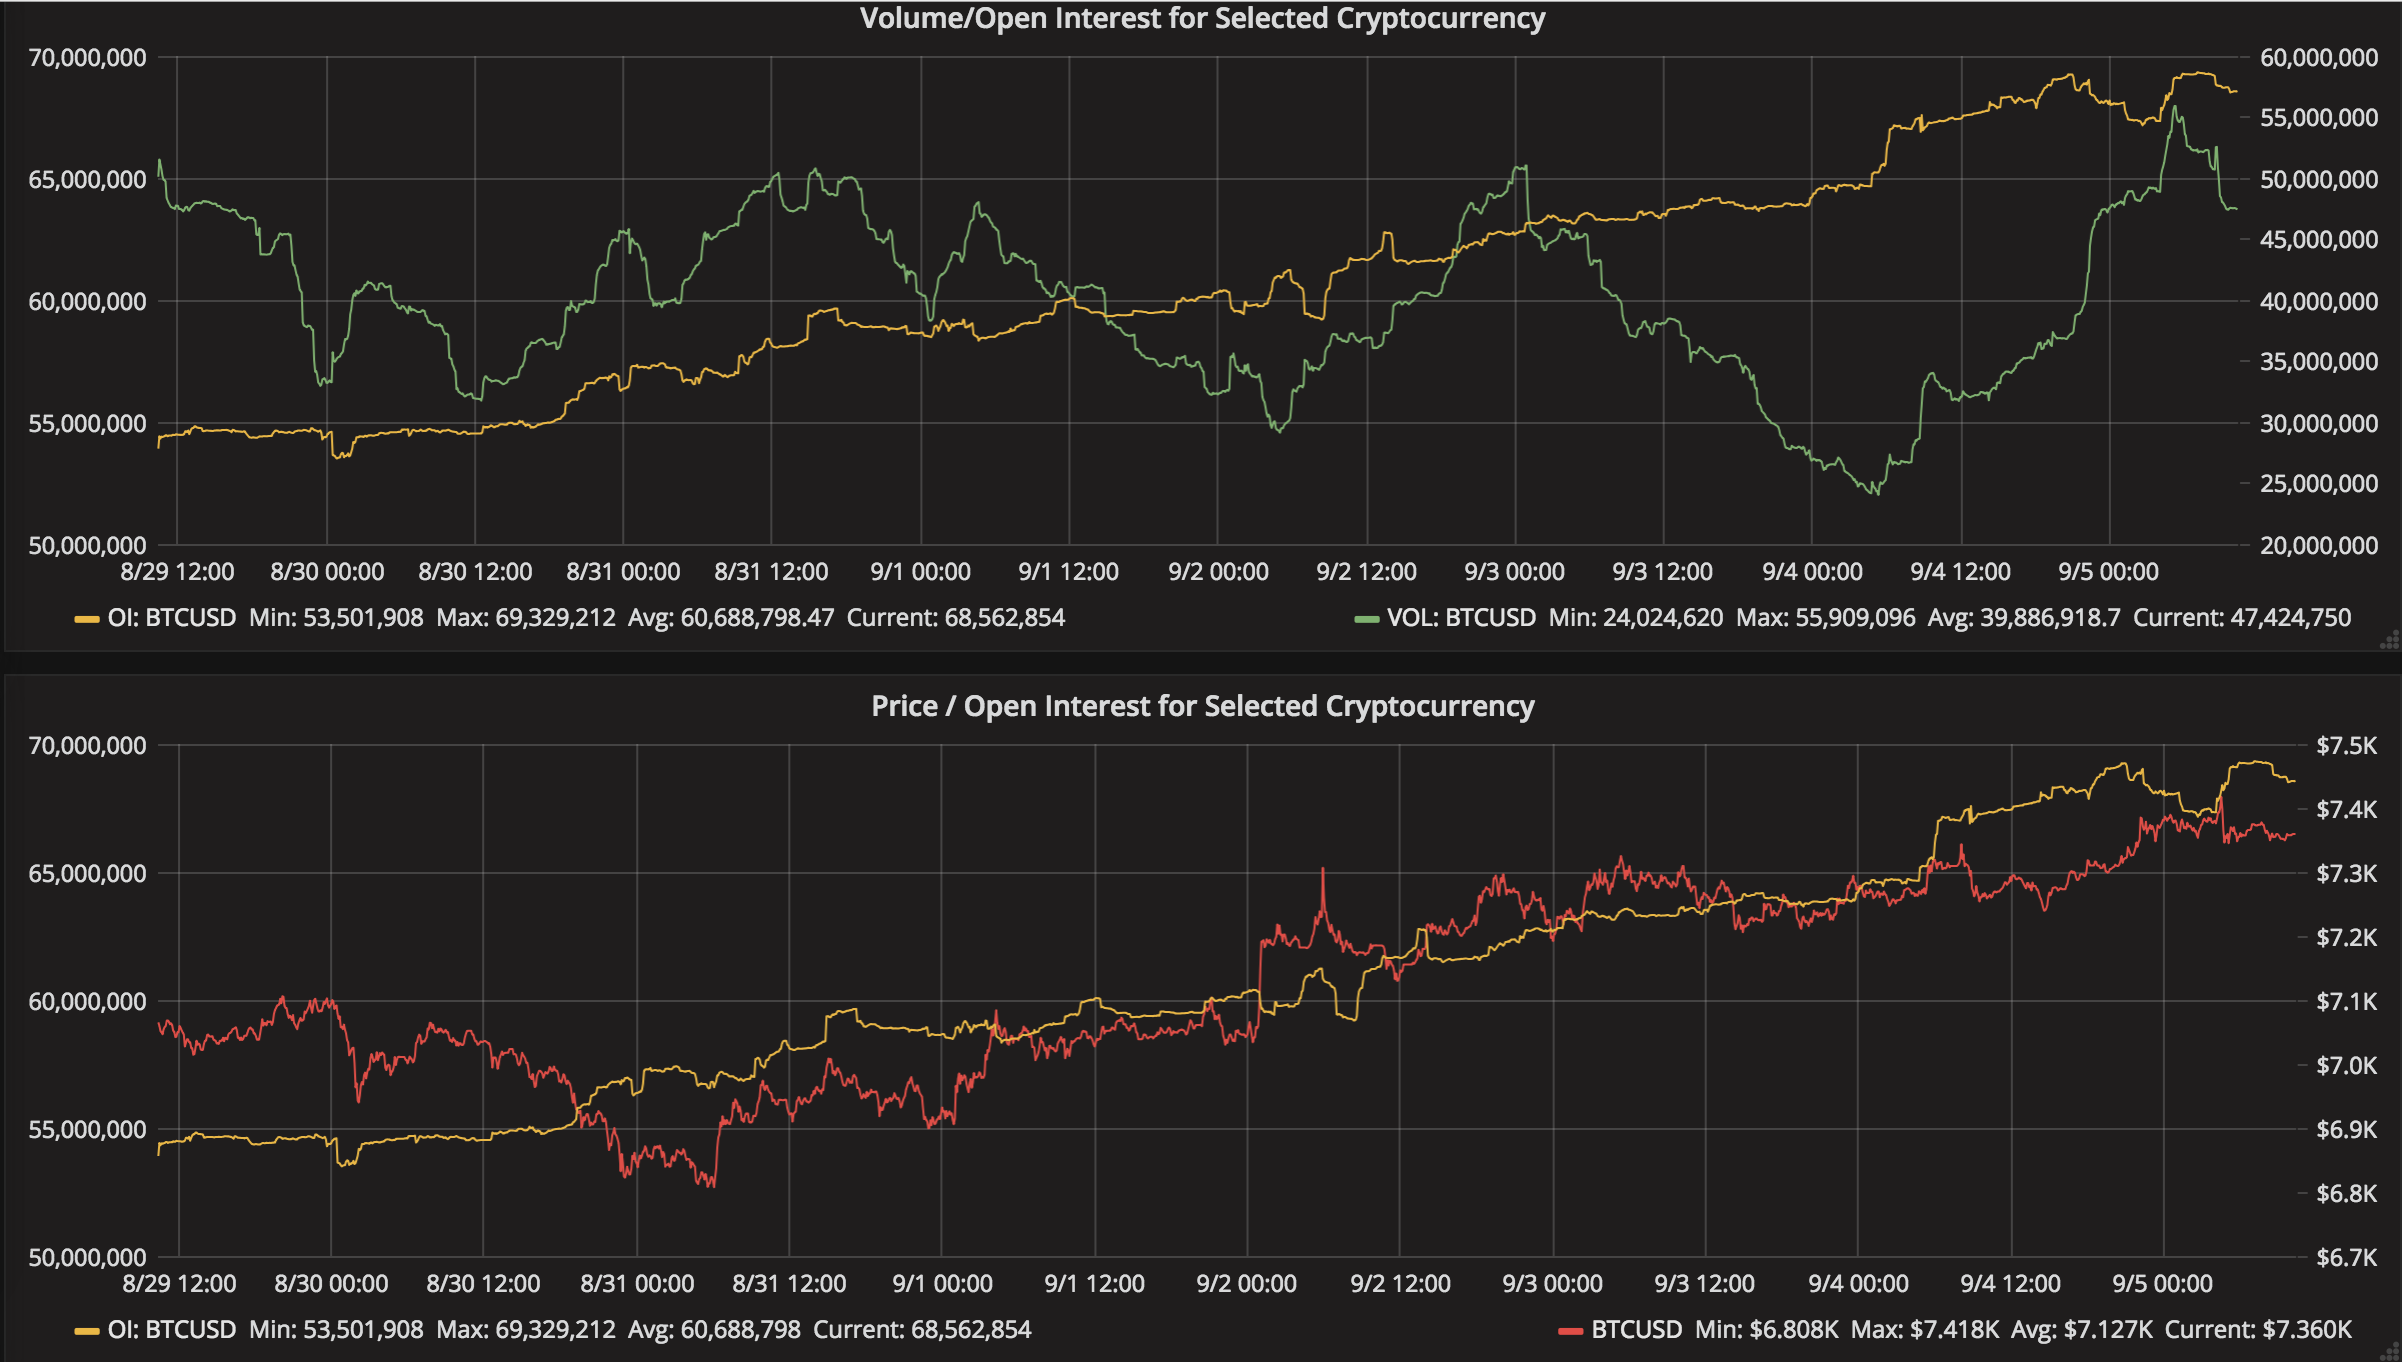
Charts from: Cryptolume Cryptocurrency Tool
What we can see happening is crossovers of sorts here, but let’s pay attention to one of the last trends. Let’s zoom in here:
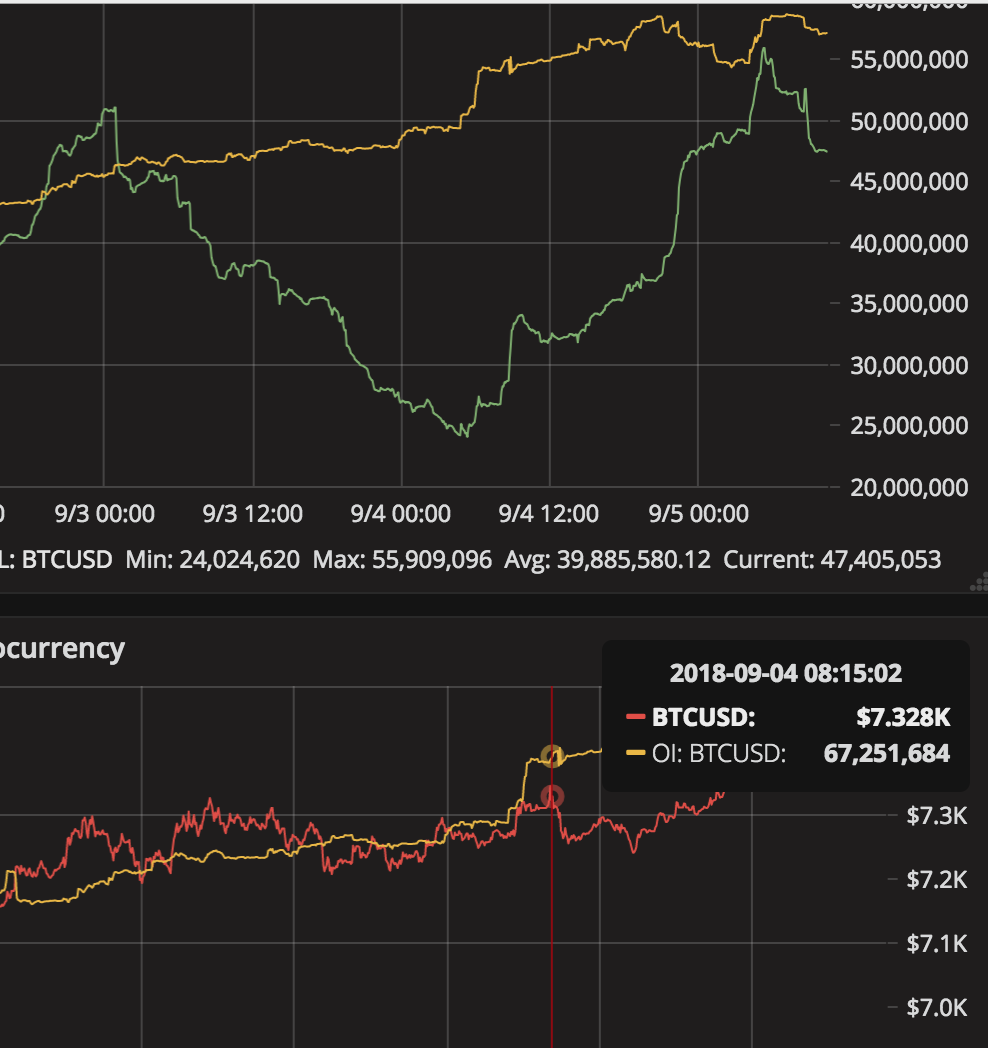
Just before the price dropped, there was evidence in open interest and volume rising, even before the price dropped. An hour before. However, the price quickly recovered and this is considered a weak market for futures trading as price was falling, but OI and Volume were on the rise.
As you can see, these metrics don’t tell you what to do however they can confirm your trade setups given you’ve done the right technical analysis already from your end.
Conclusion
Understanding price, volume and open interest is typically done before charting and technical analysis patterns so feel free to use this information for educational purposes only if you’re new.
With experience, these metrics will provide you the most simple form of being able to judge the price reversal or continuation of a trend.
Disclaimer:
This article is not considered investment advise, it is purely educational information. Margin / futures trading carries significant risk. Cryptolume cannot be held responsible for the accuracy of the content on this post or for decisions taken by readers based on such information.