Demonstration Video
Our demonstration video will showcase our fast and efficient cryptocurrency trading tool that’s been used by hundreds since 2017.
Cryptolume was designed to save you hours that you would’ve otherwise spent on charts and reading forums or news posts to understand which coins are moving in terms of fundamental and technical analysis.
Scroll down further to see details on specific features.
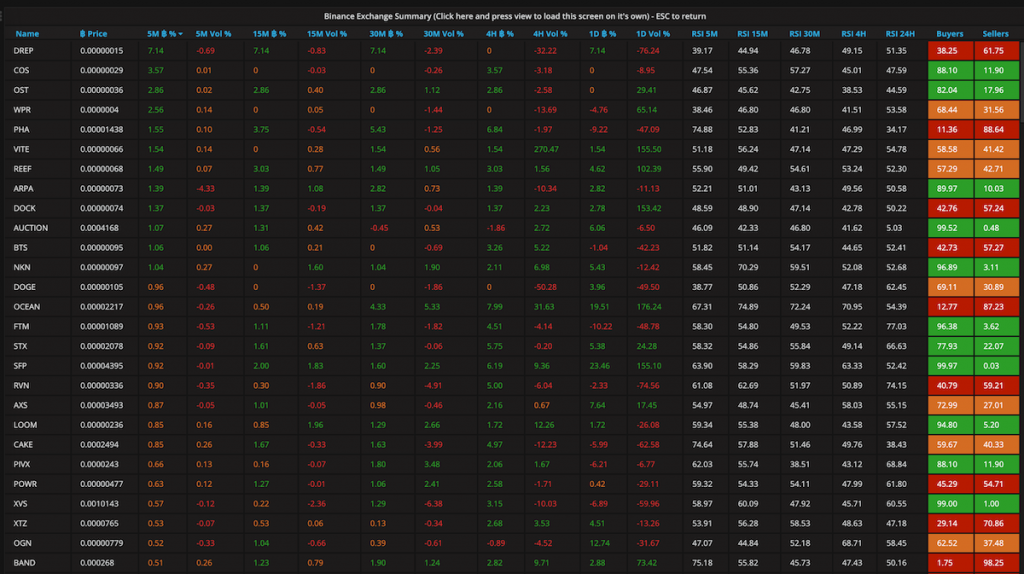
Crypto Screener / Scanner (Exchanges)
Get a birds-eye view of an entire exchange, the pairs they support and also major timeframes all on one page. Definitely a ruthless tool that is used by hundreds in Cryptolume to find fast updates on where price/volume is going.
Most exchanges will only provide you with 24 hours and 7-day data. With Cryptolume you’re able to see timeframes as low as 5 minutes so that you can get information on volume and price faster than ever before.
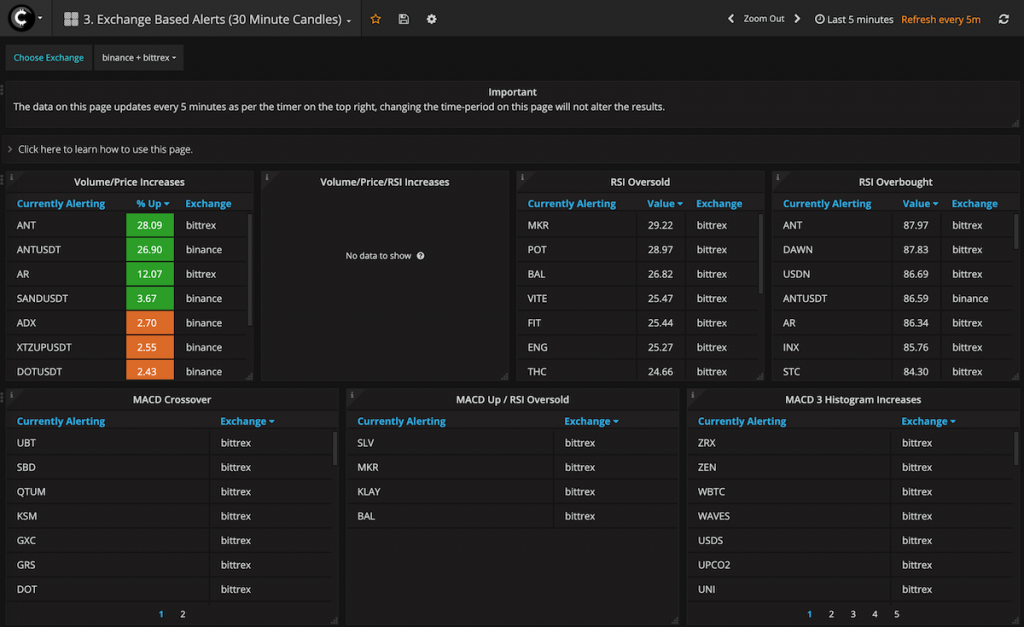
Trading Indicator Alerts
Get our algorithmic alerts which have been designed to catch volume/price increases via our crypto screener. You can also get alerts on Trading Indicators such as MACD Crossovers, RSI Oversold, and much more.
We produce over 1,000 alerts every 5 minutes for over 8 exchanges. The power is unmatched by any competitor.
With our “Advanced” plan you’re able to get alerts sent directly to your Mobile or Desktop device so you’ll be alerted on moving indicators, as they happen.
Exchange Volume Analyzer
With Cryptolume you can select as many cryptocurrencies as you want and analyze the volume for them over time visually.
If you have ever tried to find historical volume information, you’ve probably realized it’s hard to do especially with websites like CoinMarketCap where you need to look at volume on table data.
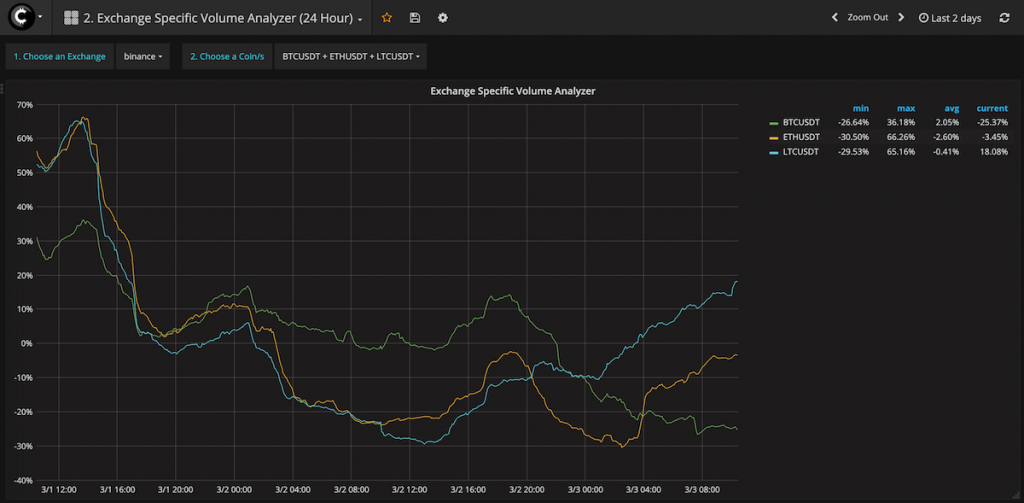
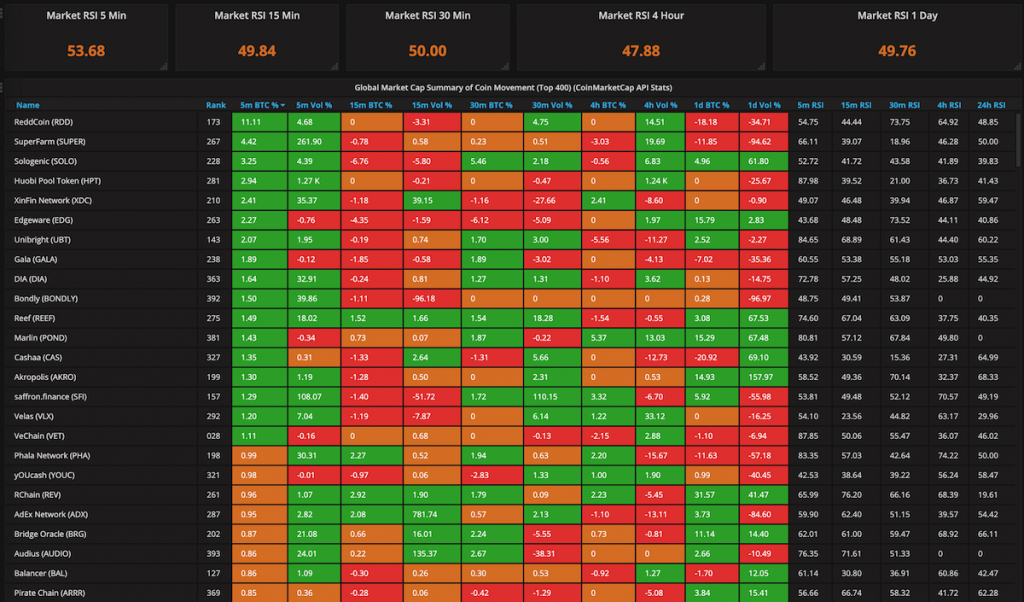
Table of Movement
The Table of Movement is a consolidated view of top-performing cryptocurrencies. Basically, this is the same data as you would see on CoinMarketCap however we provide you with faster data such as 5 minutes as well as consolidated RSI data.
With the Table of Movement you can also see the top 400 coins and sort them accordingly without having to jump to a second page, this really lets you see which coins are up and coming into the top 100 list before everyone else does.
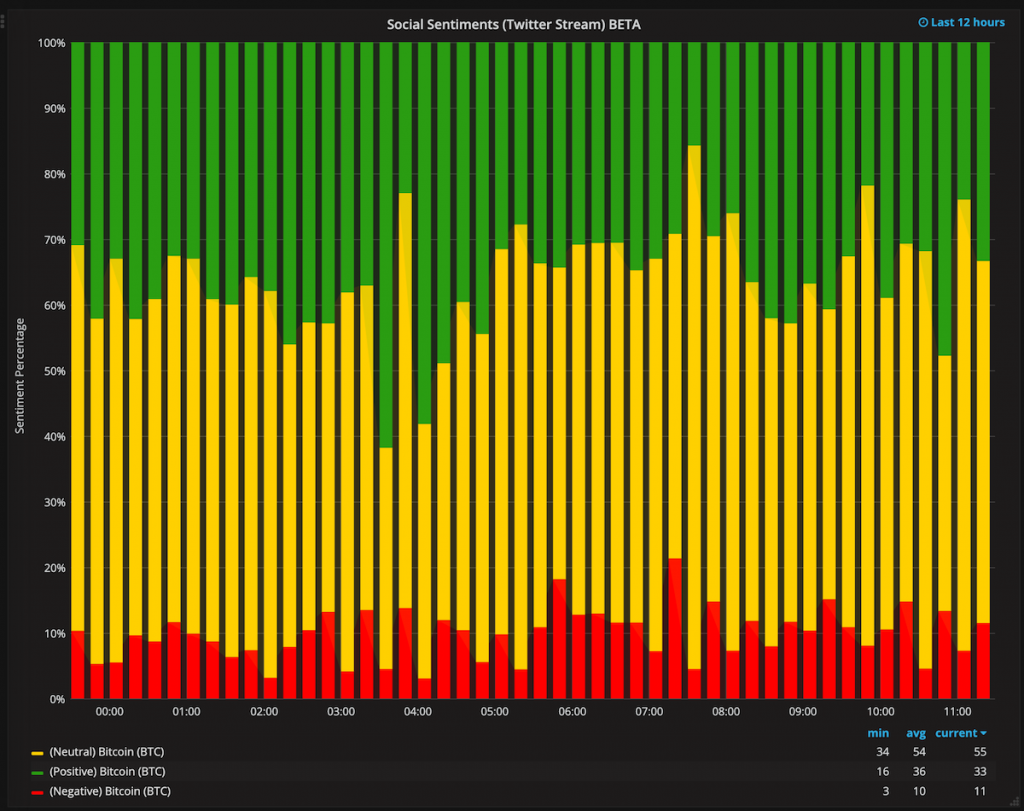
Crypto Sentiment Analysis
With our Sentiment Analysis tool, you can see where the hype is currently for the coin of your choosing.
This is a great addition for those that are looking to automate some of their fundamental analysis to go with their trading.
One of the most popular features that our members have come to love.
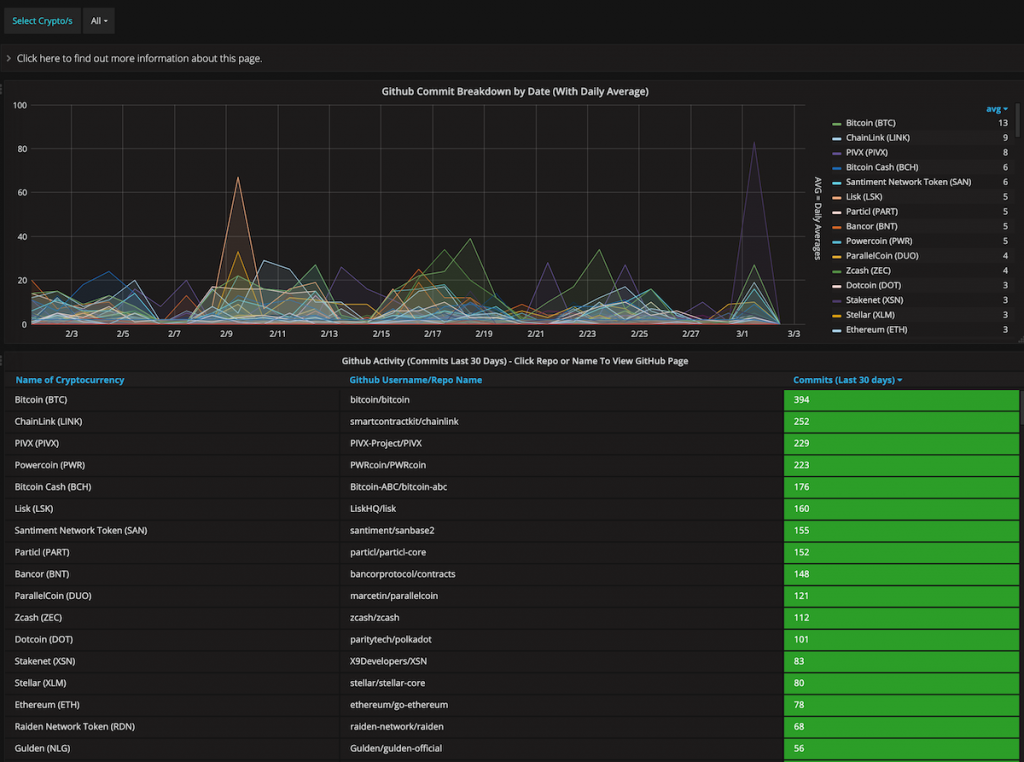
Project Development Analysis
Our Table of Developer Activity tool will show you how active a project is on GitHub, and just how many changes they’ve been doing.
This is another useful tool for your fundamental analysis as it will tell you if a project is dead in terms of development or if they’re actively working on it.
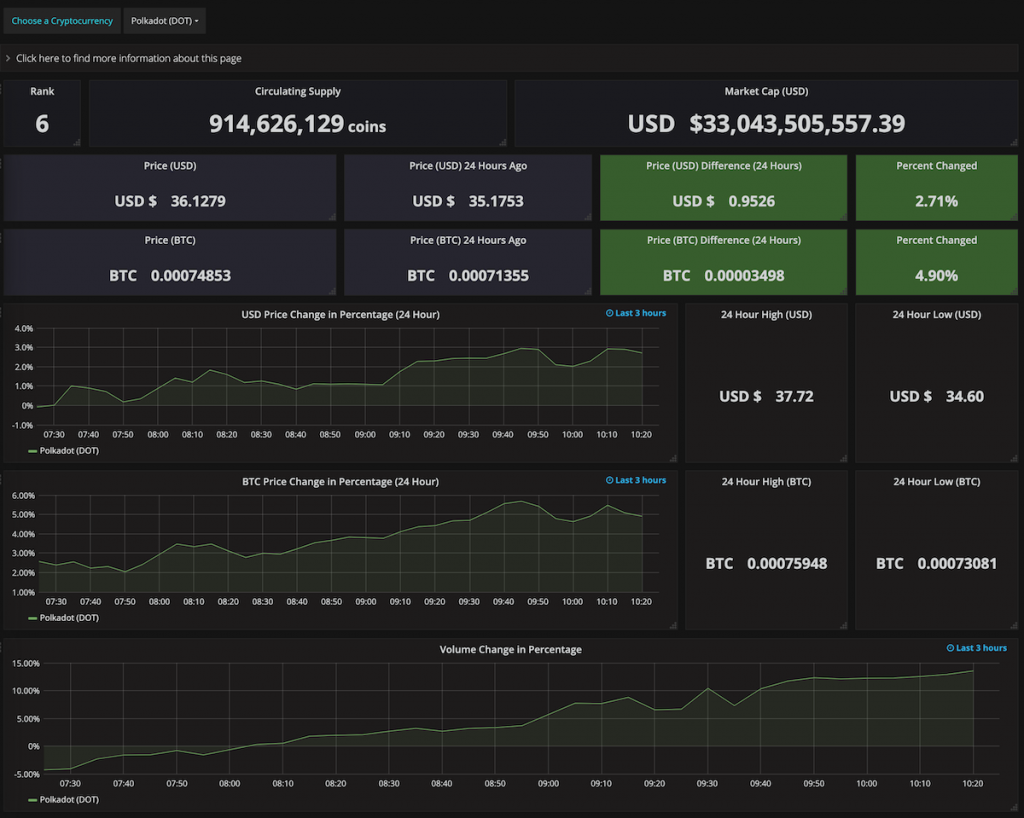
Summary Dashboard
Our Summary Dashboard will show you quick and efficient information on your coin of choice.
It also contains details on RSI on multiple timeframes, sentiments around the coin as well as recently changed volume and price performance.
A great tool to get a quick glimpse of your coin on the market.
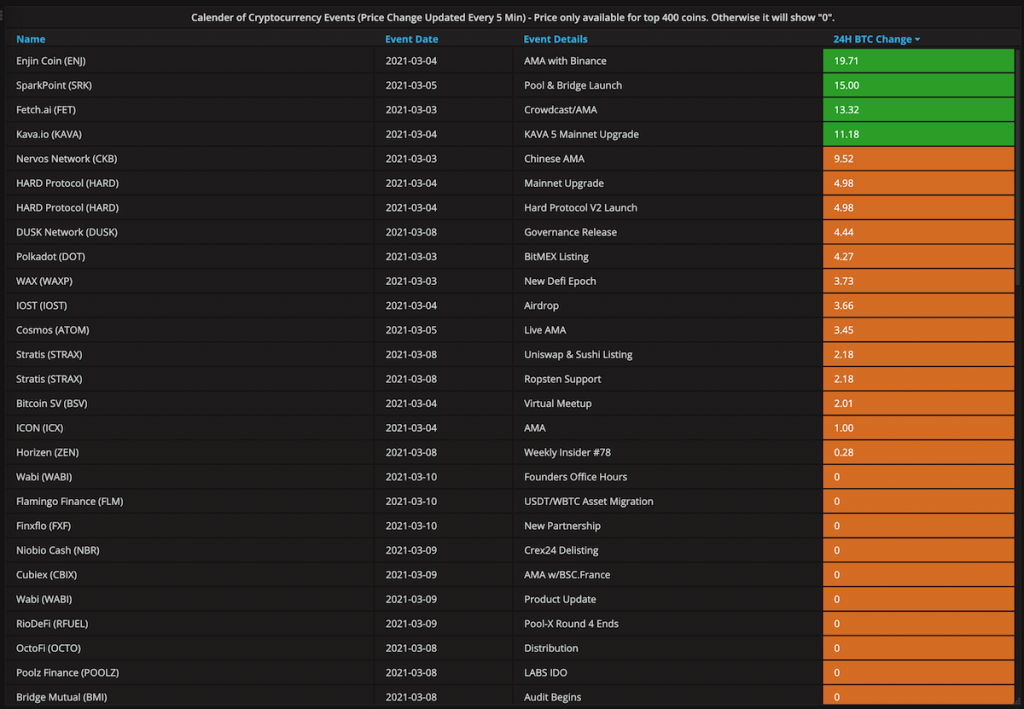
Crypto Event Calendar
Our Table of Developer Activity tool will show you how active a project is on GitHub, and just how many changes they’ve been doing.
The Crypto Event Calendar will track cryptocurrencies that have upcoming events such as a halving, or a conference.
Further to this, we will also display a 24-hour price change to determine if the event is bringing some price action.
Another great tool to add to your fundamental analysis arsenal.
Cryptolume Screenshots
Full List Of Cryptolume Features
Below is a comprehensive list of our features and how they can help you start making a mark in the crypto space. Tools such as this help in both bearish, and bullish times. Whatever your goals, we have the data available.
Cryptolume Platform
This isn't for everyone
Disclaimer: Whilst our platform helps you run technical and fundamental analysis very easily, you always still need to do your own research before making an investment. Cryptolume is to be used only as a research tool and your trades should not be based on the information we provide. We connect out to many different API’s such as exchanges, that could have outages at any time which is out of our control.
Pick up a subscription with Cryptolume and get 30% off during the promotion of our new website launch.