Most investors love to trade cryptocurrency perhaps because it is a highly volatile asset. If you can predict the market correctly, crypto can guarantee you much higher returns compared to traditional investments.
However, you always risk losing your crypto to the market if you don’t trade carefully! Because cryptocurrency prices are highly volatile, it is common for active traders to lose money fairly faster trading cryptocurrencies. And this is why is imperative you develop a thirst for knowledge to take your crypto trading skills to the next level.
Provided you’ve already put in place a stringent risk management strategy, you should be able to minimize your losses significantly. And your first line of defense against the volatile crypto trading market is enhancing your knowledge of crypto trading indicators.
Trying to understand the cryptocurrency price chart for the first time can be a challenging experience. After all, there are so many colors, different lines, and numbers to interpret.
As experts in the industry, we are here to help you understand what crypto indicators are and how to use them to make the most informed decisions. These indicators are an essential tool for making the most out of your trading efforts.
So, what are crypto trading indicators?
Just as the name implies, these are unique tools used in technical analysis that help market players in their quest to gauge price movements. It is worth noting that technical analysis uses historical data to provide mathematical models of potential price action and the models are thereafter turned into market indicators.
The resulting data from the models are then represented on a graph, which is then overlaid on a trading chart to help traders make decisions.
Most popular crypto trading indicators:
1. Relative Strength Index:
 The RSI is arguably the simplest and perhaps easiest to interpret and demonstrates whether an asset is oversold or overbought. RSI is a momentum indicator that measures the extent of recent price fluctuations to evaluate either overbought or oversold conditions in the price of an asset.
Developed by Wilder Welles in 1978, this technical analysis indicator allows crypto traders to gauge how far or close the Bitcoin’s price is from its true value. With such insight, the trader can then take advantage of the condition before the market normalizes. Using this tool, you can easily identify great trading entry points and maximize your returns.
Relative Strength Index uses a somewhat simple formula to establish whether an asset and in this case, bitcoin is oversold or overbought. Based on the formula, a value that ranges between 0-100 is found and is usually represented on a chart using an oscillator. It features two distinctive lines, one at 30 and the other at 70. When the reading is greater than 70, the asset is regarded to be overbought whereas when it’s below 30, it is considered oversold.
2. Moving Averages:
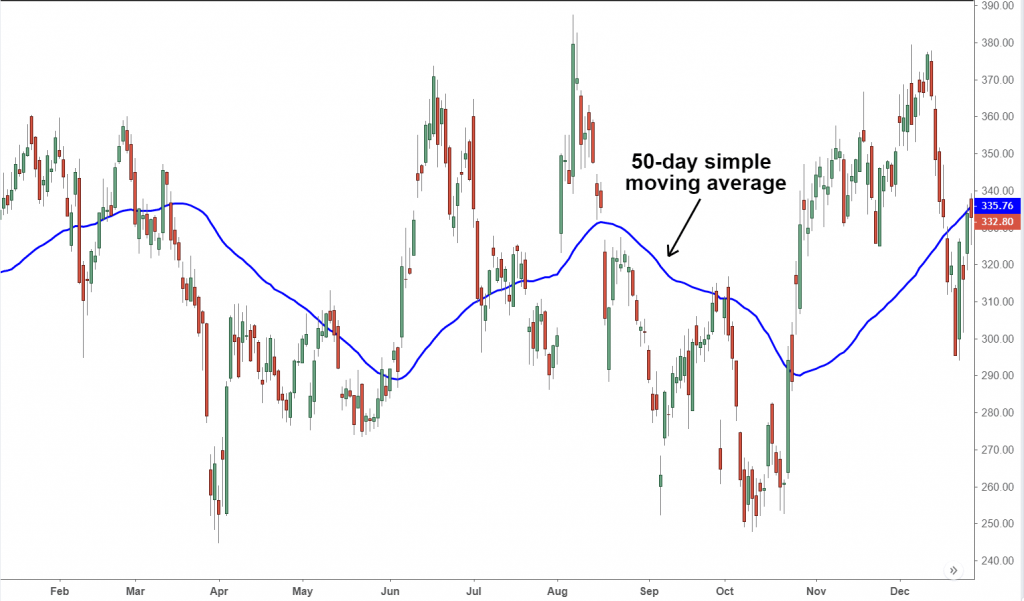 One of the most popular crypto trading tools, the moving average indicator that can help traders gauge a future direction of a current trend of the asset price. Just as the name implies, a moving average examines the average price movement of a crypto asset over a specified time.
Moving averages are calculated by taking daily price points within a specified time, and subsequently dividing these price points by the specified number of days over a specific period.
There are two types of moving averages, including simple moving average and exponential moving average. If you are a short-term crypto trader, the simple MA might suit your trading style better. On the other hand, if you are a dedicated trader, the exponential moving average is preferred.
Moving averages also show a change in sentiment, whether bearish or bullish. What’s more, they serve as support levels for crypto assets when prices go down. On most occasions, traders view moving averages as a price base, from which the price of a crypto asset may bounce, resulting in a price correction. Besides, the MA indicator can be used to evaluate historic levels of resistance and support, helping predict future price movements.
3. Ichimoku Cloud:
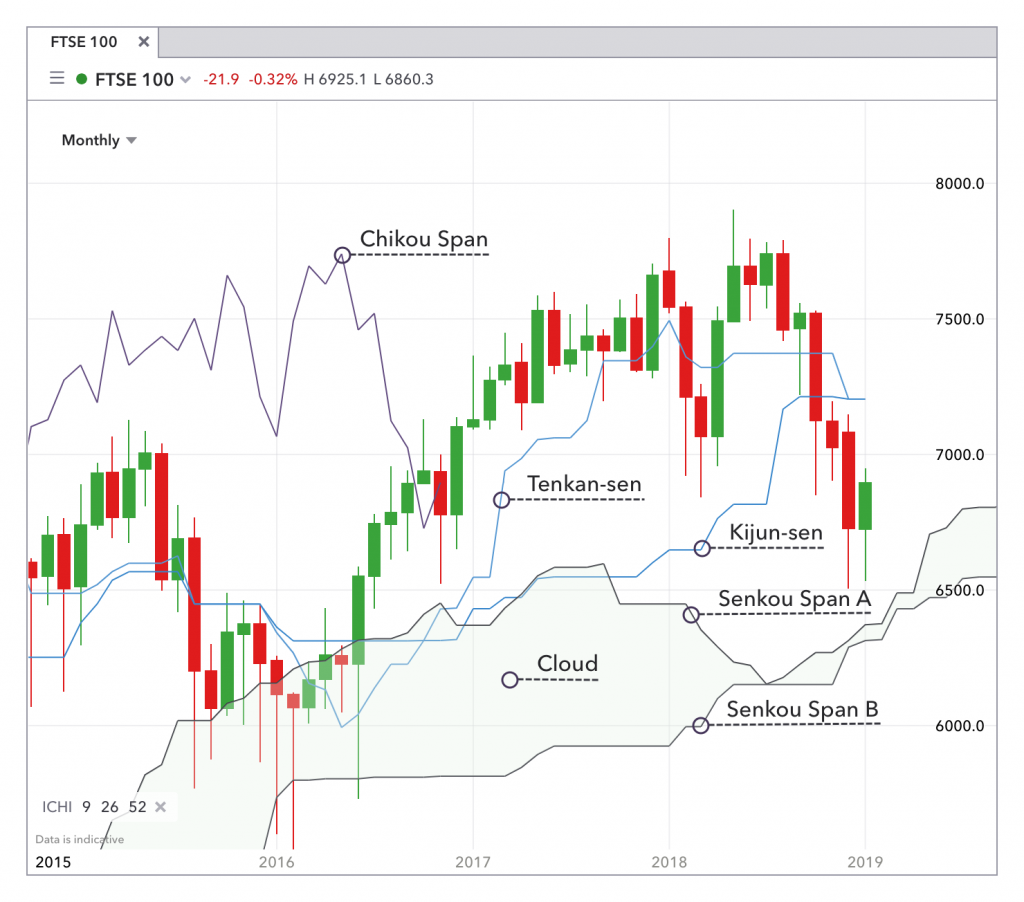 Commonly referred to as Cloud, this is a highly versatile indicator that can be used to observe multiple parameters, including resistance and support levels, as well as trend and momentum direction. This all-in-one tool allows traders to observe a number of indicators in a single visualization to help with the prompt decision-making process.
Ichimoku is often viewed as a fairly more powerful and complete version of moving averages. In terms of interpretation, Ichimoku Cloud features five distinct lines, each showing averages over certain periods which are determined by you, the trader.
When two of the lines intercept, the area between them is shaded to form a cloud. And when the current price is above the shaded area (cloud), it implies the trend is on an upward trajectory.
On the other hand, when the price is beneath the cloud, the trend is perceived to going down. Also, if the cloud is moving in the price’s direction, the trend is believed to be strong.
4. Bollinger bands:
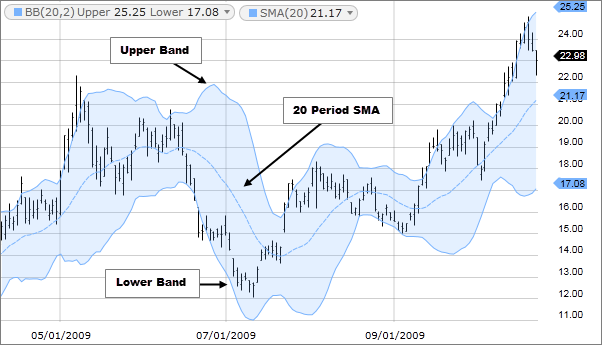 Developed by Bollinger John, a renowned financial analyst, Bollinger Bands is a crypto trading indicator that works as an oscillator measurer, showing whether a market has low or high volatility, or even if the oversold or overbought conditions exist.
Bollinger Bands are specifically designed to identify opportunities that offer traders a higher chance of properly discovering when an asset is overbought or oversold.
Bollinger Bands are composed of a moving average line, an upper band, and a lower band. The other two bands move away from the moving average line when the volatility is high and move closer to the middle band when volatility is low.
If the price of an asset moves beyond the moving average and surpasses the upper Bollinger bands, it can be established that the market in an overbought condition. On the other hand, if the price reduces significantly and either touches or exceeds the lower band a couple of times, this indicates an oversold market.
Simply put, Bollinger bands are ideal for short-term trading because they allow traders to predict the most likely market movements.
5. Fibonacci Retracement:
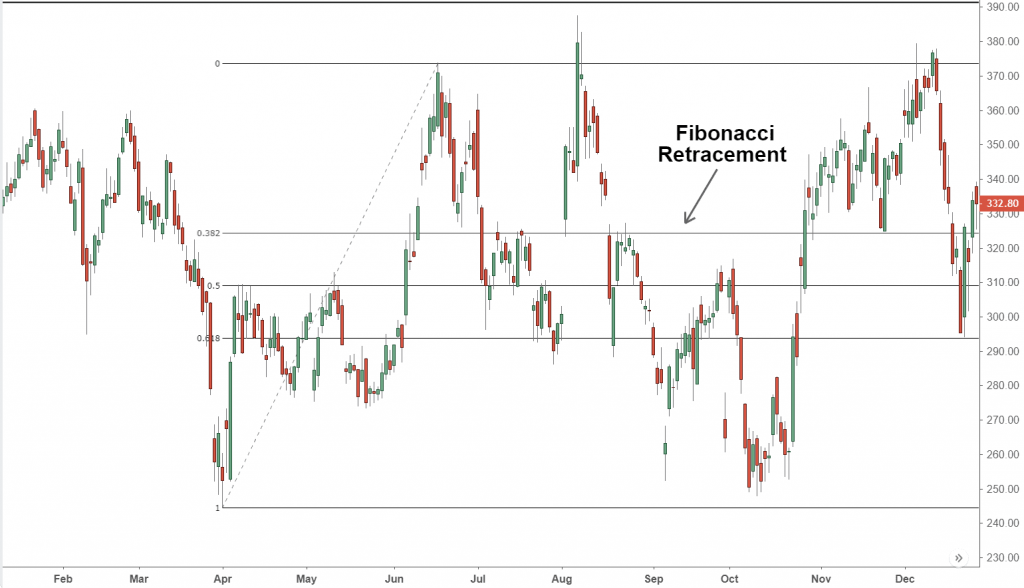 Here is another decent indicator both established and novice crypto traders can use to forecast or predict the extent to which a certain asset could potentially move from its current price.
This indicator helps traders to know potential resistance and support levels that are likely to indicate a change in trend.
This technique is usually used by traders to determine where to close or open trading positions and is particularly important during price discovery.
When no historic data is available to help compare existing market conditions, this tool can be a crucial tool for determining potential price targets. As such, it remains one of the go-to crypto trading indicators.
Bottom Line:
In a traditional market, traders heavily depend on indicators to help them make informed financial decisions simply because they predict both the direction and strength of the market. Crypto trading isn’t an exception, and you’ll need to use the available crypto indicators to trade successfully.